作 者:Lin, JC; Xu, RW; Wu, XH; Shen, YJ;Li, QSQ
影响因子:5.901
刊物名称:PLANT JOURNAL
出版年份:2017
卷: 91(5) 页码: 829-839CPSF100 is a core component of the cleavage and polyadenylation specificity factor (CPSF) complex for
30-end formation of mRNA, but it still has no clear functional assignment. CPSF100 was reported to play a
role in RNA silencing and promote flowering in Arabidopsis. However, the molecular mechanisms underlying
these phenomena are not fully understood. Our genetics analyses indicate that plants with a hypomorphic
mutant of CPSF100 (esp5) show defects in embryogenesis, reduced seed production or altered root
morphology. To unravel this puzzle, we employed a poly(A) tag sequencing protocol and uncovered a different
poly(A) profile in esp5. This transcriptome-wide analysis revealed alternative polyadenylation of thousands
of genes, most of which result in transcriptional read-through in protein-coding genes. AtCPSF100
also affects poly(A) signal recognition on the far-upstream elements; in particular it prefers less U-rich
sequences. Importantly, AtCPSF100 was found to exert its functions through the change of poly(A) sites on
genes encoding binding proteins, such as nucleotide-binding, RNA-binding and poly(U)-binding proteins. In
addition, through its interaction with RNA Polymerase II C-terminal domain (CTD) and affecting the expression
level of CTD phosphatase-like 3 (CPL3), AtCPSF100 is shown to potentially ensure transcriptional termination
by dephosphorylation of Ser2 on the CTD. These data suggest a key role for CPSF100 in locating poly
(A) sites and affecting transcription termination.
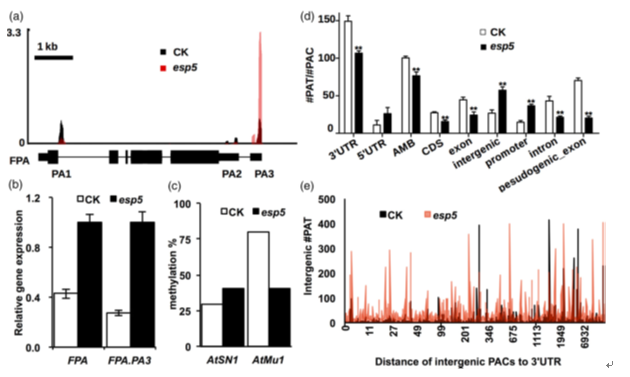
Fig. 4.AtCPSF100 exerts its effect by adjusting alternative polyadenylation of FPA and limits intergenic poly(A) tags (PATs).
(a) The PAT-sequencing read coverage of FPA.
(b) Quantitative RT-PCR confirmation of the total expression level and distal poly(A) transcripts of FPA.
(c) DNA methylation levels of AtSN1 and AtMu1. Clone numbers are n (CK AtSN1) = 11, n (esp5 AtSN1) = 7, n (CK AtMu1) = 20, n (esp5 AtMu1) = 17. (CK, is the
marker transgenic plant, with construct amp311.)
(d) The ratio of PAT/poly(A) cluster (PAC) calculated on the basis of adjusted P-value < 0.05 significantly changed in different regions in esp5, particularly in the
intergenic areas. **P < 0.01 between ck and esp5.
(e) Plot of the intergenic PATs with their distance (in bp) to the 30 untranslated region (UTR). Most of the intergenic PACs were upregulated in esp5, especially
near the 30 UTR. ‘Distance’ is between the intergenic PAC coordinate and 30 UTR end coordinate. Significant PACs (adjusted P-value < 0.05) were selected for
plotting. n = 545, n (distance < 2 kb)="456." [colour figure can be viewed at wileyonlinelibrary.com].