作 者:Li, H.Y., Shi, L., Wang, D.Z., andWang, M.H. 影响因子:2.056
刊物名称:Aquat Toxicol
出版年份:2015
卷:166页码:42-49
Here, through a multigenerational life-cycle test,Tigriopus japonicuswere exposed to different mercuric chloride treatments in seawater (nominal concentrations of 0, 0.5, 1, 10, and 50μg/L) for five successive generations (F0–F4), and subsequently all the treatments were recovered in clean environments for one generation (F5). Six life history traits (survival, developmental time for nauplius phase, developmental time to maturation, fecundity, number of clutches, and number of nauplii/clutch) were examined for each generation. Mercury (Hg) accumulation was also analyzed for the adult copepods in the F1, F3,and F5. The results indicated that Hg accumulated in a dose-dependent manner for the F1, F3, and F5generations. Moreover, higher Hg contents were observed in F3 than F1 at the same exposure levels. Among the six life history traits, only fecundity and number of nauplii/clutch showed a greater sensitivity to Hg toxicity, and the inhibitory effects worsened from F0 to F3, which was explained by a trend for higher metal accumulation with increasing generations. In the recovery generation (F5), none of the traits differed from the control, highlighting that Hg might not induce any epigenetic or parental effects in the following generations. Thus, we hypothesized that although cumulative effects might have been involved in Hg multigenerational toxicity, physiological acclimation, that is, phenotypic plasticity could explain Hg tolerance obtained by marine copepods. Impacts on important life history traits could disturb the population dynamics of some important marine copepods, hence having unexpected ecological consequences in the marine ecosystem. Yet, the Hg harmful impacts rapidly fade away as the Hg is learedfrom the environment.
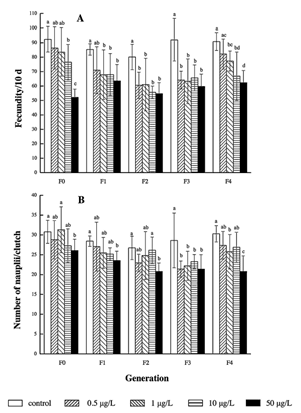
Fig. 2.Fecundity (A) and number of nauplii per clutch (B) of five generations ofTigriopus japonicusexposed to different mercury chloride concentrations (control, 0.5, 1, 10,and 50μg/L). Data are described as means ± SD (n = 6). Different letters indicate a significant difference among different mercury treatments at P < 0.05.