作 者:Liu, X; Xiao, WP; Landry, MR; Chiang, KP; Wang, L;Huang, BQ影响因子:3.742
刊物名称:ECOSYSTEMS
出版年份:2016
卷:19 页码: 832-849
We investigated seasonal and spatial patterns of phytoplankton variability in the East China Sea in order to understand biomass and compositional responses to environmental factors in the contemporary ocean. We used satellite imagery from 2002 to 2013 to define the mean seasonal climatology of sea surface temperature and chlorophylla. Phytoplankton and environmental measurements were synthesized for the study region and four seasons from 11 cruises conducted from 2006 to 2012. The results of CHEMTAX analyses on group-specific phytoplankton composition were consistent with those of microscopy and flow cytometry observations, revealing three patterns of seasonal variability. Canonical correspondence analysis and generalized additive models (GAMs) were used to resolve the spatiotemporal variations of major phytoplankton groups and their relationships to month, temperature, salinity, nutrients, mixed layer depth, and bottom depth. Monsoon forcing drove the distributional patterns of environmental factors and was critical to explaining phytoplankton dynamics at the seasonal scale. Compared to autumn and winter, significantly higher chlorophyll a concentrations were observed during spring and summer, associated with the spring bloom and the Changjiang (Yangtze) River plume, respectively. Diatoms dominated biomass over the East China Sea, especially during the summer months influenced by the Changjiang (Yangtze) River plume, whereas dinoflagellates were especially important during spring blooms. GAMs analysis showed the differences in their responses to environmental variability, with a clear mid-range salinity optimum (similar to 31) and a more pronounced temperature effect for dinoflagellates. The photosynthetic bacteria,ProchlorococcusandSynechococcus, both increased strongly with warming, butProchlorococcusshowed stronger sensitivity to variations in physical environmental parameters, whereasSynechococcuswas more responsive to chemical (nutrient) variability, with broader tolerance of low-salinity conditions.
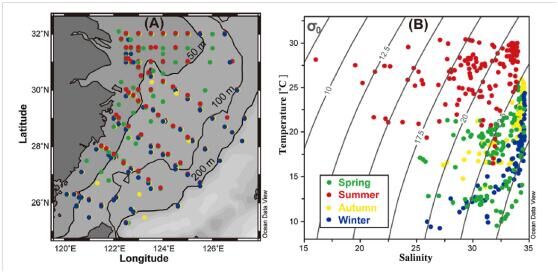
Fig. 1.Map of sampling stations (A) and temperature-salinity (T–S) diagram of surface water samples (B) from 11 cruises in the East China Sea from 2006 to 2012. The isobaths of 50, 100, and 200 m are indicated by theblack solid lines.Color codedenotes season of sampling. Specific cruise dates and sample numbers are given in Table1.