作 者:Liu, X., Chiang, K.P., Liu, S.M., Wei, H., Zhao,Y., andHuang, B.Q. 影响因子:2.692
刊物名称:Deep-Sea Research I
出版年份:2015
卷:106 页码:17-29
In early spring, a hydrological front emerges in the central Yellow Sea, resulting from the intrusion of the high temperature and salinity Yellow Sea Warm Current (YSWC). The present study, applying phytoplankton pigments and flow cytometry measurements in March of 2007 and 2009, focuses on the biogeochemical effects of the YSWC. The nutrients fronts were coincident with the hydrological front, and a positive linear relationship between nitrate and salinity was found in the frontal area. This contrast with the common situation of coastal waters where high salinity values usually correlate with poor nutrients. We suggested nutrient concentrations of the YSWC waters might have been enhanced by mixing with the local nutrient-rich waters when it invaded the Yellow Sea from the north of the Changjiang estuary. In addition, our results indicate that the relative abundance of diatoms rangedfrom 26% to 90%, showing a higher value in the YSCC than in YSWC waters. Similar distributions were found between diatoms and dinoflagellates, however the cyanobacteria and prasinophytes showed an opposite distribution pattern. Good correlations were found between the pigments and flow cytometry observations on the picophytoplankton groups. Prasinophytes might be the major contributor to pico-eukaryotes in the central Yellow Sea as similar distributional patterns and significant correlations between them. It seems that the front separates the YSWC from the coastal water, and different
phytoplankton groups are transported in these water masses and follow theirmovement. These results imply that the YSWC plays important roles in the
distribution of nutrients, phytoplankton biomass and also in the community structure of the central Yellow Sea.
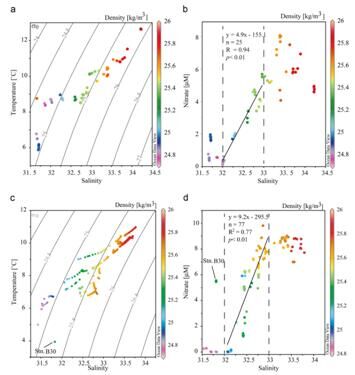
Fig.5.The T/S diagram of all stations and the relationship between nitrate concentrations and salinity in the central Yellow Sea during March 2007 (a and b) and 2009 (c and d). Location of Stn. B30 is indicated in Fig. 1b. The density is potential density anomaly (kg m-3).