作 者:Li, Y.,Li, Y.F., Qureshi, S., Kappas, M.,Hubacek, K. 影响因子:2.307
刊物名称:ECOLOGICAL MODELLING
出版年份:2015
卷:318 页码:100-108
In order to improve water quality and ecosystems health, the focus of river ecological restoration andwater ecosystem-based managementmneeds to reach beyond its usual policy domain by restricting theexpansion of urban built-up land and reducing urbanization-related pollution. This study aims to assess the impacts of urbanization on water quality for three spatial urban development zones, i.e. center, inner peri-urban and outer peri-urban of the eastern coastal municipality of Lianyungang, China. We analyze the relationship between urban landscape ecological pattern and water quality in three landscape zones. The study explores this relationship and its policy implications. The results of our analysis are as follow: (1) In the center zone, the landscape pattern metrics, largest patch index (LPI) and total class area (CA) were strongly correlated with water quality parameters, such as CODMnand NH3–N; (2) In the inner periurban zone, the number of significant relations of land use pattern metrics and water quality parameters in 2008 was greater than that in 2000 and 2004; (3) land use pattern metrics in the outer peri-urban were less correlated to water quality than in the other zones; (4) the degree of correlation in different spatial zones was in following order: center (2008 > 2000 > 2004), inner peri-urban (2008 > 2000 > 2004), outer peri-urban (2004 > 2000 = 2008). Thus, the relationships between landscape and water quality varies significantly over space due to varying watershed characteristics and pollution sources across space.
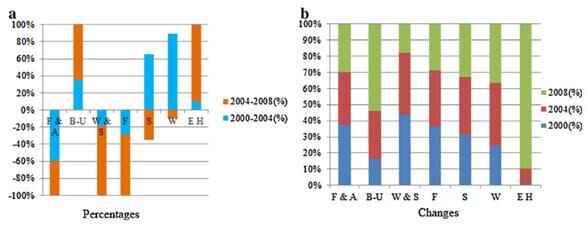
Fig.2.Land cover percentages and change in the study area (2000 to 2008). (note: F & A: farmland and arable land; B-U: built-up; W & S: wetland (saltern dominant); F:forest; S: sea; W: water; E H: bare hill).