Zhu X.D., Hou Y.W., Weng Q.H. and Chen L.Z.. 2019. Isprs Journal of Photogrammetry and Remote Sensing, 149: 146-156.
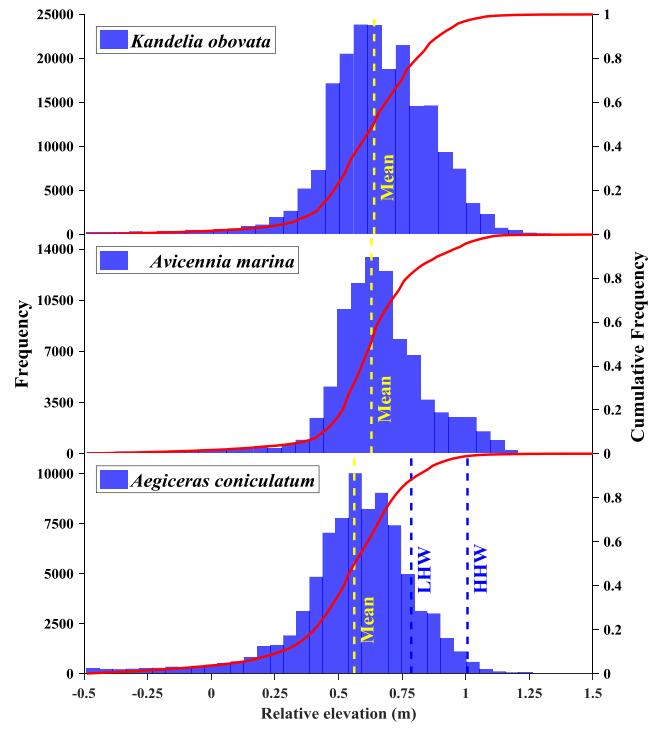
Mangrove-inundation patterns have been examined in many feld studies, but spatially explicit quantitative analyses are still lacked. A better understanding of how mangrove species responds to the inundation gradient will facilitate mangrove conservation and management. In this study, we integrated unmanned aerial vehicle (UAV) camera imagery and light detection and ranging (LiDAR) data for exploring mangrove-inundation spatial patterns over the intertidal zone in a subtropical estuarine wetland (Zhangjiang estuarine wetland, Fujian, China). Our results indicated that > 90% of mangrove forests (mainly Kandelia obovate, Avicennia marina, and Aegiceras corniculatum) were situated within a one-meter elevation range between local mean sea level and higher high water, and the spatial distribution of mangrove forests showed hump-shaped patterns along the inundation gradient with favorable inundation periods of 2–5 h per day. Our analyses further indicated that there was a weak mangrove zonation pattern with overlaps between species zones along the elevation gradient, and that mangrove species had differential inundation sensitivities with Avicennia marina being most sensitive to the inundation stress. To the best of our knowledge, this is the first spatially explicit quantitative study to examine the influences of inundation regime on both spatial distribution and canopy height of different mangrove species over the intertidal zone at the landscape scale. This study highlights the practicability and necessity of UAV LiDAR in interpreting mangrove-inundation spatial patterns, and confirms the importance of inundation regime as a key driver in regulating the spatial patterns of mangrove forests. The determination of appropriate elevation ranges and inundation periods provides some important knowledge to guide mangrove restoration practices and to assess the vulnerability of mangrove forests in response to future sea level rise.

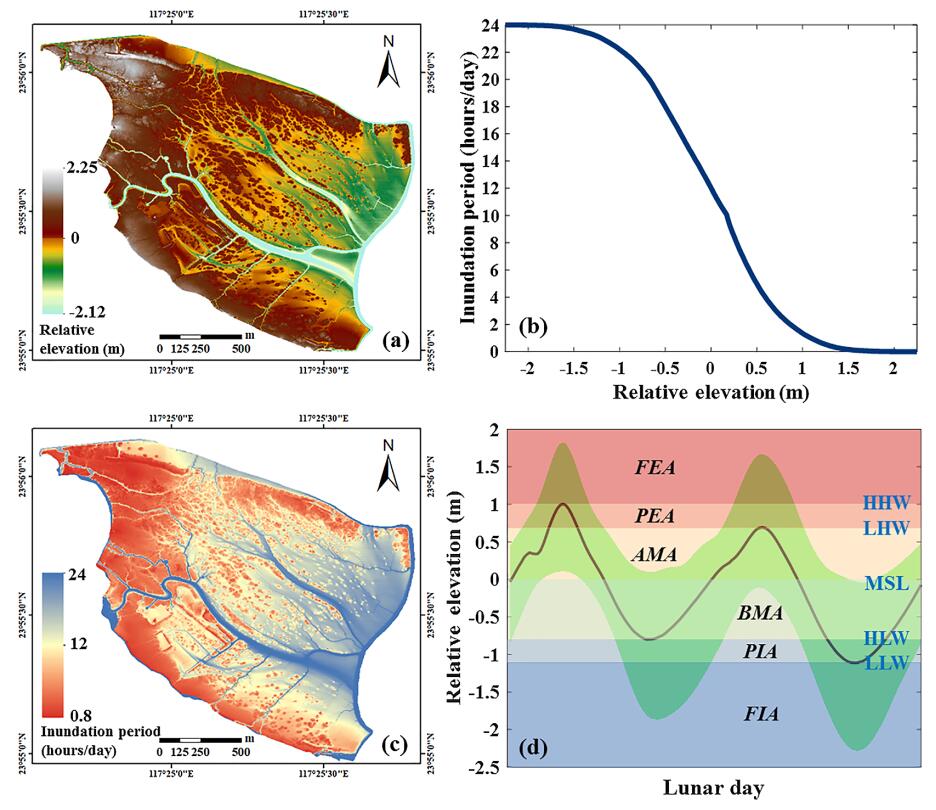
Figure 1. Spatial distributions of (a) relative elevation (meter) and (c) annually mean inundation period (hours per day) over Zhangjiang estuarine wetland. The quantitative relationship between relative elevation and inundation period over this wetland was illustrated (b). Mean water level curve over a lunar day (solid line) with varying ranges (shaded area), derived from one-year tidal measurements, was shown for characterizing tidal inundation regime (d). Five relative elevations and corresponding six inundation areas were marked for higher high water (HHW), lower high water (LHW), mean sea level (MSL), higher low water (HLW), lower low water (LLW), fully exposed area (FEA), partially exposed area (PEA), above MSL area (AMA), below MSL area (BMA), partially inundated area (PIA), fully inundated area (FIA).

Figure 2. Frequency distribution (shaded area) and cumulative frequencies (solid lines) of relative elevation for each of three main mangrove species over Zhangjiang estuarine wetland. Mean relative elevation for each species, lower high water (LHW), and higher high water (HHW) were indicated by vertical dashed lines.

