Fu H.H., Wang P., Wu X.H., Zhou X.X., Ji G.L., Shen Y.J., Gao Y.H., Li Q.S.Q. and Liang J.R.. 2019. The Plant Journal, 99: 67-80.
The post-transcriptional regulation involved in the responses of diatoms to silicon is poorly understood. Using a poly(A)-tag sequencing (PAT-seq) technique that interrogates only the junctions of 3′-untranslated region (UTR) and the poly(A) tails at the transcriptome level, a comprehensive comparison of alternative polyadenylation (APA) was performed to understand the role of post-transcriptional regulation in various silicon-related cellular responses for the marine diatom Thalassiosira pseudonana. In total, 23701 poly(A) clusters and 6894 APA genes, treated with silicon starvation and replenishment, were identified at nine time points. Significant APA was found in numerous genes (e.g. five cingulin genes) closely associated with the silicon-starvation response, girdle bands and valve synthesis, suggesting that many genes participated in the responses to silicon availability and biosilica formation through changes in transcript isoforms. The poly(A) site usage profiles were distinct during various stages of silicon biomineralization responses. Moreover, a correlation between APA and expression levels of APA switching genes was also discovered. This is an interesting study that presents a genome-wide profile of transcript ends in diatoms, which is distinct from that of higher plants, animals and other microalgae. This work provides an important resource to understand a different aspect of cell-wall synthesis.

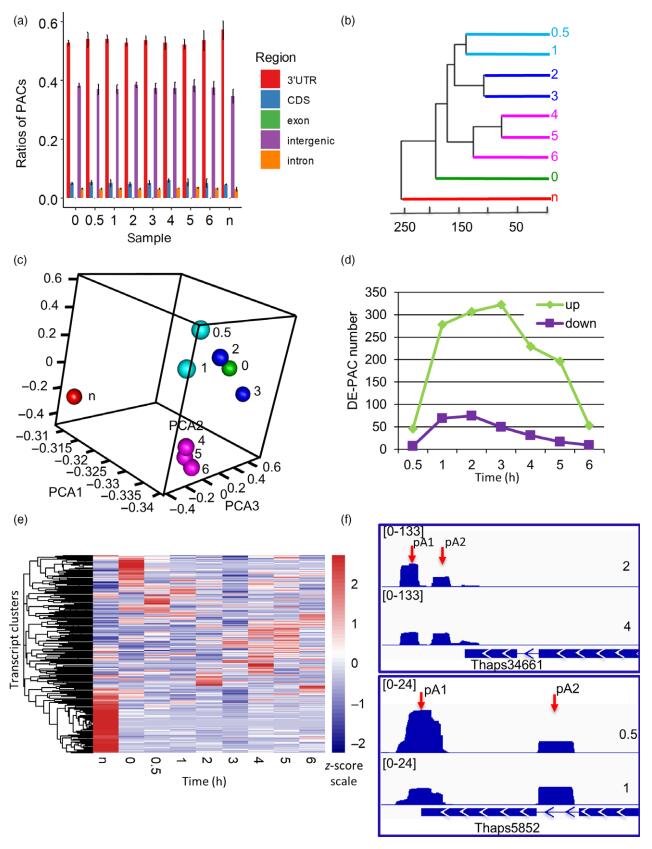
Figure 1. Poly(A) cluster (PAC) expression patterns in the responses to silicon availability of the diatom. (a) Ratios of PACs in genic regions. CDS, Coding sequences; UTR, untranslated regions. n, mid-exponential cells. (b) The Euclidean distances among samples (indicated as treatment h on the right-hand side) as calculated from normalized log transformation. (c) Principal component analysis of PAC expression patterns. The colour code is the same as in b. (d) DE-PAC between 0 and 0.5, 1, 2, 3, 4, 5, 6 h. (e) Heat-map showed the changes of transcripts expression via silicon starvation before and after silicon starvation, and synchronization. The Z-score of normalized PAT of DE-PACs (P-adjusted ≤ 0.01- and 4-fold change) between the mid-exponential, after silicon starvation, and replenishment across all the samples. 59 PACs were upregulated in 0 h and 360 PACs were downregulated compared with the mid-exponential cells. (f) Example tracks of two APA genes from two time points (marked on the right). The red arrow indicates the peaks of each poly(A) site. The gene structures and transcription directions (arrow heads) are denoted on the bottom, where blue blocks are annotated exons and the lines are introns.

