Sajjad M., Li Y., Li Y.F., Chan J.C.L. and Khalid S.. 2019. Earth's Future, 7(7): 805-818.
The resilience of coastal communities becomes a critical issue of the social‐ecological system adapting to impacts from hazards on coastal well‐being. This paper formulates a framework integrating typhoon destructive potential and social‐ecological system from a perspective of coastal resilience. Typhoon destructive potential is interpreted using the Power Dissipation Index as a metric. We use the distributional models in geographic information systems to identify the spatial hotspots of high Power Dissipation Index along the coast of Mainland China. Furthermore, we evaluate the community resilience in all identified hotspots with place‐based indicators within five potential dimensions (Social, Ecological, Institutional, Economic, and Safety). Though the results show no significant long‐term trends in the typhoon destructive potential, statistically significant interdecadal variations are identified in different hotspots during 1949–2014. The resilience assessment results reveal that ecological (predisaster defense) and safety resilience (postdisaster support) are critical issues in achieving coastal community resilience. We argue that improving the ecological stewardship (having great predisaster defense) and adopting integrated approaches contribute to resilience enhancement, providing opportunities to support all the dimensions of community resilience via improving the social‐economic‐ecological nexus. The integration of typhoon destructive potential and social‐ecological system helps to achieve Sustainable Development Goal 13 through risk‐informed decision‐making. The results from this study have important policy implications for local‐scale planning incorporating place‐based indicators.

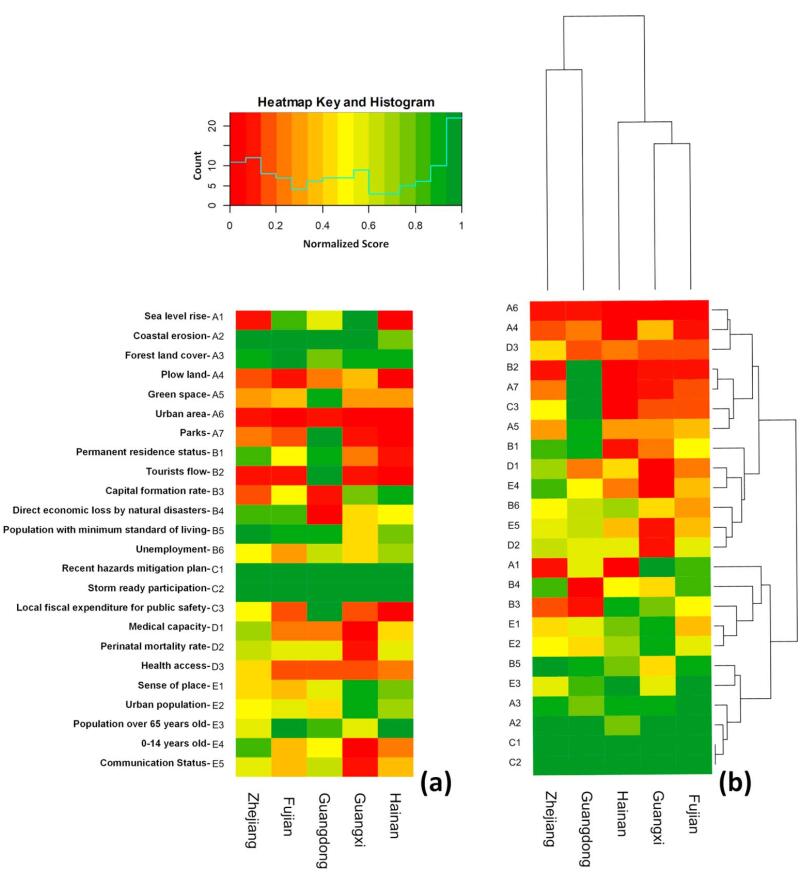
Figure 1. Heat maps representing the individual indicator score for each hotspot region to form the community resilience within the HS: (a) the original results from the model and (b) the results after applying a clustering method using Euclidean distance to find the similarity between the score of different indicators of the HS. The red color represents the lower score (likelihood of the system to be less resilient against landfalling typhoons) achieved by the regions, and green color represents higher scores achieved by the regions (likelihood of the system to be more resilient against hazards). The dendrograms [in (b)] represent the distance/dissimilarity between clusters. Note that the scores are normalized using min-max scaling method. The data used here is for the year 2015 except the D2 variable for which we use data from 2013.

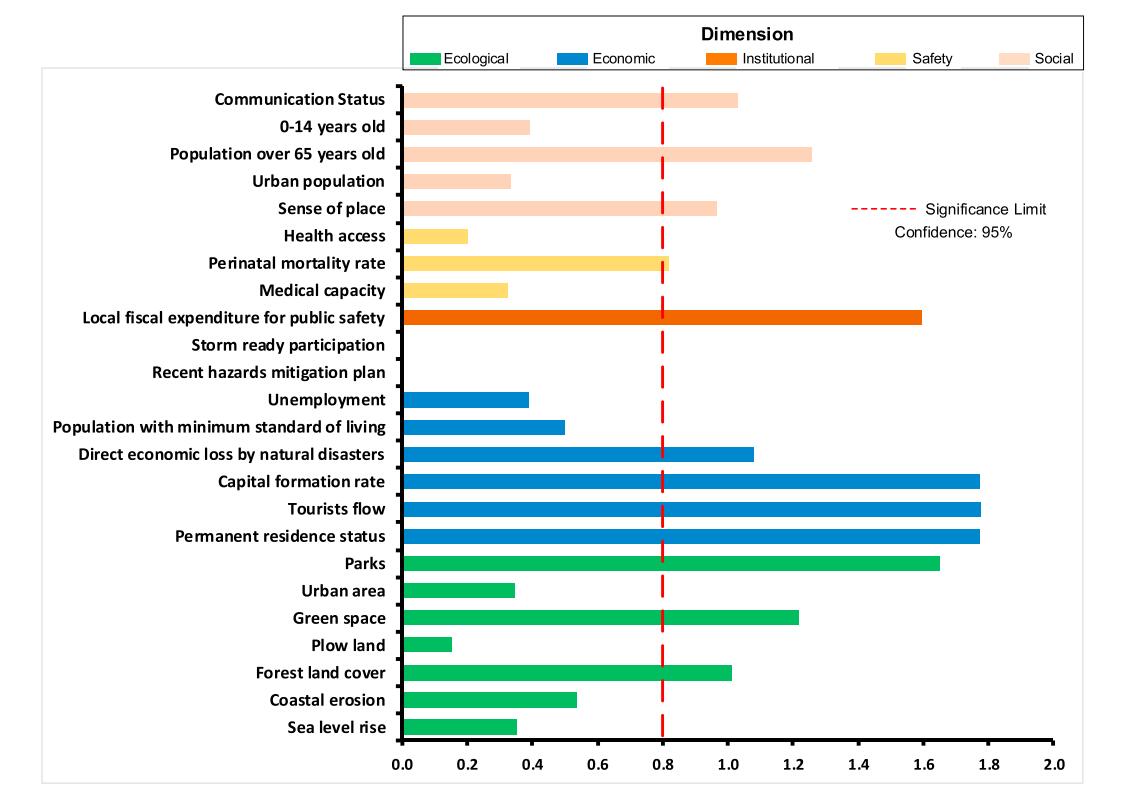
Figure 2. Variable importance (Very Important Variable Index) to form overall resilience score as calculated by PLS regression. The indicator scores are quantified using simple arithmetic mean of the scores of all hotspot regions. The importance of variables is determined by regression coefficients. If the regression coefficient for a variable is smaller than a significant limit (in our case it is 0.8), then there is a small contribution (insignificant) from that variable to form the overall resilience score.

